A cost report shows how much money has gone out. A progress report shows how much work is done. Earned value combines them in three numbers, so you see at once whether the project is overspending and whether it is late.
The three base numbers
| Number | Meaning | Where it comes from |
|---|---|---|
| PV (planned value) | The value of work that should be done by today | S-curve planned cumulative × total budget |
| EV (earned value) | The value of work actually done | Actual progress from site measurement × total budget |
| AC (actual cost) | The cost incurred for that work | The job cost report up to the cut-off |
Example at week 8
| Item | Value |
|---|---|
| Total budget (BAC) | Rp1,000 m |
| Planned cumulative at week 8 | 45%, so PV = Rp450 m |
| Actual progress | 40%, so EV = Rp400 m |
| Actual cost to the cut-off | AC = Rp440 m |
| CPI (cost index) = EV ÷ AC | 400 ÷ 440 = 0.91 |
| SPI (schedule index) = EV ÷ PV | 400 ÷ 450 = 0.89 |
| Forecast final cost (EAC) = BAC ÷ CPI | 1,000 ÷ 0.91 = Rp1,100 m |
| Forecast final variance | Rp100 m over budget |
How to read the numbers
- CPI below 1: every Rp1 of cost buys less than Rp1 of work. The project is overspending. A CPI of 0.91 means about 9% more expensive than planned.
- SPI below 1: less work is done than planned. The project is late. An SPI of 0.89 means about 11% behind schedule.
- If the CPI stays at 0.91 to the end, a Rp1 billion project will cost about Rp1.1 billion.
- CPI and SPI above 1 mean cheaper and faster than planned.
Steps every week
- Use the same budget for all three numbers: the RAP for a contractor, the RAB for an owner.
- Take this week’s planned cumulative from the S-curve for PV.
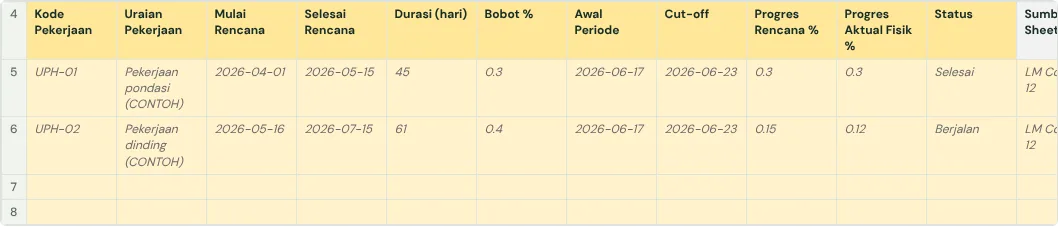
- Take actual progress from the site measurement (weight × progress per item) for EV.
- Take actual cost to the same cut-off, including costs incurred but not yet billed, for AC.
- Work out CPI, SPI and EAC, and track the trend week by week. One number can be chance; a three-week trend is more reliable.
Common mistakes
- AC and EV on different cut-off dates, so the CPI is wrong.
- EV worked out from money spent instead of physical progress. EV must come from site measurement.
- Material just delivered and not yet installed counted in AC, so the CPI looks worse.
- The budget (BAC) not updated after an addendum.
The full guide is in How to build a construction cost report that catches overruns early. It has a free template (Excel or Google Sheets) and a checker that reads your own workbook.
Ready to use the Komander agents on your projects?
When your workbook is complete, apply for a pilot: we help connect your project data to the Finance, Cost and Scheduler agents and review the first reports with you.
Send to melwani@komander.ai. Your workbook check result is included when there is one; the workbook itself is not sent.
Common questions
What is earned value?
A way to judge project cost and schedule together by comparing planned value, the value of work done, and actual cost.
What do CPI and SPI mean?
CPI = EV ÷ AC shows cost efficiency; SPI = EV ÷ PV shows speed against the schedule. Below 1 means overspending or late.
How do I forecast the final cost?
A simple way: total budget divided by CPI. Rp1,000 m ÷ 0.91 is about Rp1,100 m.
Does earned value work for small projects?
Yes. All it needs is the planned S-curve, progress measurement and weekly actual cost.